Magnetic Resonance
Mitochondrial Contribution to Magnetization Transfer in Cardiac Tissue
Kathleen M. Ward, Anthony H. Aletras, Robert S. Balaban
Lab of Cardiac Energetics, National Heart Lung and Blood Institute
National Institutes of Health, Bethesda MD
Introduction
The purpose of this study was to investigate the contribution of mitochondria to the water/macromolecule magnetization transfer in the heart. Magnetization transfer (MT) techniques can improve MRI contrast in cardiac muscle [1-3]. The specific macromolecular components of heart responsible for MT have not been identified; suggested candidates include structural and functional proteins such as collagen, actin, and myosin [2-3].
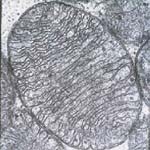
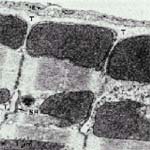
We hypothesized mitochondrial structures as an additional MT macromolecular source in heart. Mitochondria, effectively a proteinaceous crystal (Figure 1B), makes up to 25% of cardiac tissue volume. Arranged in a framework surrounding muscle fibers (Figures 2A and 2B), mitochondria contain numerous proteins and structural lipids with amino and hydroxyl groups primarily responsible for the MT effect in macromolecules. This hypothesis was tested by comparing the MT effect in isolated heart mitochondria with intact heart tissue, in-vitro, harvested from the same animal.
| |
A |
B |
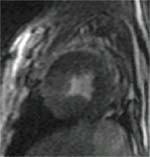
Figure 1:
(A) In-vivo MRI short axis image of canine heart with custom MT saturation pulse (Resonance offset frequency of 500 Hz, 1.5T)
(B) Electron micrograph of a single mitochondrion showing the organized arrangement of the protein matrix and the inner mitochondrial membranes. |
 |
 |
| |
|
|
| |
A |
B |
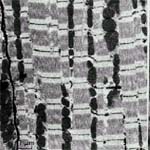
Figure 2.
Electron micrographs of
(A) Mitochondria that are immediately adjacent to muscle fibers
(B) Cardiac tissue showing the mitochondria surrounding the muscle fibers in order to provide for the high level of ATP required by this tissue. |
 |
 |
Materials & Methods
Porcine cardiac tissue and mitochondria were isolated as described in [4]; the concentration of mitochondria was 36 nmol Cytochrome a/ml [5], which matched the mitochondrial concentration in the intact myocardium. Inversion-recovery T1 and CPMG T2 (t = 4.8 ms) measurements were acquired at 7T using a Bruker AC-300 wide bore spectrometer maintained at 37oC with heated N2. Magnetization transfer spectra: observation frequency was set on the water peak and the decoupler used to provide off-resonance saturation. 5 saturation power levels were used; these were calibrated to B1 fields of 1.33, 1.85, 2.45, 3.79, 4.89 X 10⁻⁶ T, respectively. Studies were conducted at steady-state with irradiation of 15 seconds (>3 T1). The chemical shift of the exchanging protons was determined by sweeping the irradiation frequency from +1000 to –1000 ppm from water [1]. The data were plotted in the form of water amplitude versus irradiation frequency. Pulse sequence parameters: PW = 8.0 msec (Flip angle=90o), 1 acquisition/Hz offset, 8192 data points, resolution of 0.977 Hz/pt, SW=8000 Hz.
Magnetization transfer modeling of water in cardiac tissue and mitochondrial suspensions was based on the Bloch equations [6] utilizing the measured T1 and T2 parameters at specific B1 irradiation power levels. Quattro Pro© Version 6.0 (Novell, Inc., Provo, UT) was used to plot magnetization spectra; Sigma Plot© for Windows Version 4.00 (SPSS, Inc., Chicago, IL) was used to determine T1/T2 curve fit parameters.
A |
B |
 |
 |
Figure 3.
(A) MT spectra of cardiac tissue and mitochondria (36mg/ml) at B1 saturation of 1.33 X 10⁻⁶ T evaluated at T=37oC. Plots of the Bloch equation results for each sample are also plotted following T1 and T2 experiments.
(B) The modeled data in (A) is used as correction factor to eliminate the free water contribution to the MT signal, to estimate the mitochondrial contribution (D MS %) for these samples at this B1 saturation level. The resultant mitochondrial contribution is approximately 50% for this power level. |
A |
B |
 |
 |
Figure 4.
(A) MT spectra of cardiac tissue and mitochondria (36mg/ml) at B1 saturation of 2.45 X 10⁻⁶ T evaluated at T=37oC. Plots of the Bloch equation results for each sample are also plotted following T1 and T2 experiments.
(B) The modeled data in (A) is used as correction factor to eliminate the free water contribution to the MT signal, to estimate the mitochondrial contribution (D MS %) for these samples at this B1 saturation level. The resultant mitochondrial contribution is approximately 60% for this power level.. |
 |
 |
A |
B |
Figure 5. |
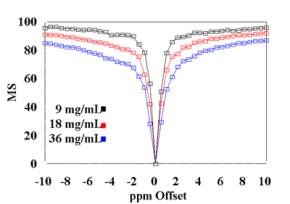
(A) Cardiac tissue and mitochondria (36 mg/ml) plotted to demonstrate the saturation power dependence of the MT effect. |
(B) Mitochondria MT spectra of three concentration levels plotted to demonstrate the dose dependent MT effect. Saturation power used in these spectra was 1.33 X 10⁻⁶ T. |
A |
B |
C |
D |
 |
 |
 |
 |
| |
|
|
|
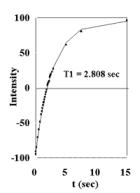
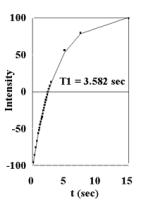
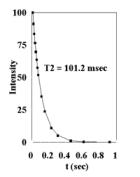
Figure 6.
Plots of cardiac tissue (T=37oC, 7 T) (A) T1 data from inversion-recovery experiments (B) T2 data from CPMG experiments. Plots of mitochondria in solution (36mg/ml, T=37oC, 7 T) (C) T1 data from inversion-recovery experiments (D) T2 data from CPMG experiments. |
Results
Figures 3A and 4A contain plots of the magnetization spectra of cardiac tissue and mitochondria obtained at 37oC for B1 = 1.33 X 10⁻⁶ T (Figure 3A) and 2.45 X 10⁻⁶ T (Figure 4A). The raw data shown in these figures suggest that the physiological concentration of mitochondria can support ~ 50% MS effect observed in cardiac tissue. The Bloch equations were used to calculate the models of the free water in both cardiac tissue and mitochondrial samples evaluated:
MS = M0(w - wO)2T22/[(w - wO)2T22 + (gB1)2T1T2]
where (w - wO) is the offset irradiation frequency (rad/sec), g is the gyromagnetic ratio for protons, B1 is the off-resonance saturation (T) of the reactants. The frequency specific results of these calculations for mitochondria and cardiac tissue are also presented for B1 = 1.33 X 10⁻⁶ T (Figure 3A) and 2.45 X 10⁻⁶ T (Figure 4A).
This correction provided a strategy to eliminate the effect of free water present in both samples. Figures 3B and 4B are plots of mitochondria and cardiac tissue where the Bloch model value of free water MS was subtracted from the data. The relative mitochondrial contribution to the MT effect seen in cardiac tissue is estimated by the ratio (D MS%). This ratio was calculated from (MSMito- MSMito Free Water model)/(MSCardiac- MSCardiac Free Water model) and is also presented in Figures 3B and 4B. The preliminary estimate of ~ 50% MS of mitochondrial contribution to the MT effect observed in cardiac tissue is confirmed following the elimination of the modeled free water from the data from each samples. At a saturation power level of B1 = 1.33 X 10⁻⁶ T, the ~50% contribution is directly confirmed, and increases (to ~60%) as the saturation power increases to 2.45 X 10⁻⁶ T.
The MT effect is saturation power dependent as demonstrated in Figure 5A, where raw data from mitochondria and cardiac tissue is presented as a function of two different saturation power levels. An additional dose dependent effect of mitochondrial concentration on MS was observed in agreement with theory and is presented in Figure 5B. [7]
The data is also provided in Figures 6A, 6B, 6C, and 6D from T1 Inversion-recovery and T2 CPMG experiments on mitochondria and cardiac tissue (37oC). Under these conditions, at 7T: cardiac tissue T1 =2.808 sec , T2 = 16.6 msec and 116.3 msec (Bi-exponential fit); mitochondrial T1 = 3.582 sec, T2 = 101.2. These values were used to calculate the Bloch equation models for sample free water. The data indicate that mitochondrial water is in essentially fast exchange with the extra-mitochondrial water in both the T1 and T2 time domains. Similar values for T1 and T2 have been observed from liver mitochondria [10]; the shorter T2 measured was most likely due to the presence of metals in liver samples. No multi-component relaxation is observed for the mitochondria experiments, unlike the two component T2 fit of the cardiac tissue results.
Conclusions
Mitochondrial data indicates that these structures contribute to approximately 50% of MT effect seen from cardiac tissue in-vivo (at saturation offset > 10 ppm). This is consistent with the proposed structure of mitochondria as near protein crystals providing an excellent source of MT. A further contribution to MT effect may arise from the motion restriction and ordered arrangement of mitochondria within cardiac tissue, conditions that were not simulated in this study.
Under ischemic conditions, mitochondria swell and lyse, causing severe, and potentially irreversible damage to the myocyte [8]. The degradation of mitochondria has also been proposed as an initial step in tissue apoptosis [9]. Decreases in MT have been observed in both acute and chronic infarct [3]. These changes have been suggested to arise from a disruption in myofilament structure and arrangement. However, the current results suggested that decreases in MT may arise, in part, from the effects of ischemia on mitochondrial structure. MT may be a useful tool in evaluated viable mitochondrial content in heart tissue. This approach may prove useful in evaluating the viability of myocardium.
References
Wolff, S., and Balaban, R., Magn. Reson. Med., 10:135;1989.
Balaban, R., Chesnick, S., Hedges, K., Samaha, F., Heineman, F., Radiology, 180:671;1991.
Scholz, T., Hoyt, R., DeLeonardis, J., Ceckler., T., and Balaban, R., J. Magn. Res., 33:178;1995.
Mootha, V., Arai, A., and Balaban, R., Am., J. Physiol., 272:H769;1997.
Balaban, R., Mootha, V., and Arai, A., Anal. Biochem., 237:274; 1996.
Ho, W., and Martin, J., J. Magn. Reson.., 43:328;1981.
Harrison., R., Bronskill., M., Henkelman, R., Magn. Reson. Med., 33:490; 1995.
Halestrap, A., Connern, C.,, Griffiths, E., and Perr, P., Mol. Cell Biochem., 174(1-2):167; 1997.
Brenner C., Marzo, I., and Kroemer, G., Exp. Gerontol., 33(6):543; 1998.
López-Beltrán E., Maté M., Cerdán S., J. Biol. Chem., 271:10648; 1996.
|