| Mitochondrial Energetics
RAPID CALCIUM ACTIVATION OF OXIDATIVE PHOSPHORYLATION: THE KINETICS OF mVO2, NADH AND LIGHT SCATTERING.
Paul R. Territo, Stephanie A. French, and Robert S. Balaban
Laboratory of Cardiac Energetics, National Heart Lung and Blood Institute, Bethesda Maryland 20892 USA
Introduction
Classically ATP production, via oxidative phosphorylation (ox-phos) has been postulated to occur by a cytosolic feedback of ADP and Pi (1); however numerous studies in heart (2), brain (3), liver (4), kidney (5), and smooth muscle (6) do not show changes in [ADP] or [Pi] lending little support to this contention. Alternatively, it has been speculated that Ca2+, and known second messenger of the cell, can stimulate mechanical work in parallel with mitochondrial ATP production, minimizing changes in [ATP] with workload, as seen in vivo.
Support for this premise comes from work in isolated mitochondria, where Ca2+ is known to activate NADH production through allosteric modification of the calcium sensitive dehydrogenases (CaDH) (7,8), in parallel with ATP production via the F0/F1ATPase (8,9). Although such a parallel mechanism balances supply and demand, matrix accumulation of Ca2+ was thought to occur too slowly to mediate changes in ox-phos on a beat-to-beat basis (10); however, studies using isolated cells (11-13) and mitochondria (14,15) have shown that matrix accumulation of Ca2+ is rapid and transmit directly into the mitochondrion.
Therefore, the aim of this study was to test the hypotheses that Ca2+ activation of ox-phos: 1) can increase respiration fast enough to keep pace with changes in metabolic demand, as observed in vivo; 2) can stimulate CaDH production of NADH fast enough to match changes in phosphorylation, as observed in vivo; 3) these process are due to matrix accumulation of Ca2+, thus resulting in increases in mitochondrial volume.
Methods & Materials
Porcine hearts were harvested and retrograde perfused (40C) as described previously (8,16). Mitochondria were isolated (8,16) and cytochrome A (Cyta) content was determined as described in (17). Isolated mitochondria were loaded stoichiometrically with 1 nmol 5 (and 6)-carboxy-2’-7’-dichlorofluoresceindiacitate succinimidyl ester (CF; Molecular Probes, Eugene OR) per nmol Cyta at 40C as described in (8,16).
O2 consumption, NADH production, and light scattering rates were determined in a closed system respirometer (370C) with optical ports at 0o and 180o. In all cases optical data were collected with a linear CCD array (Ocean Optics Inc) at 100mSec.spectra-1 at a spectral resolution of 1nm.pixel-1 (FWHM) over the spectral bandwidth 320-1024nm. Purified metal free Hb was used as an optical reporter of [O2] as described in Figure 1. NADH excitation (360?10nm Hg/Xe lamp) and reception were at 0o, and were corrected for 1o and 2o scattering as described in (8,16). Data are expressed as the ratio of coefficients (INADH.ICF-1) from a least squares linear regression for each spectra.The average R2 for intra (0.992?0.0005, average n=4072.study-1) and inter (0.990?0.0006, total n=28500) study concordance were high. Light scattering was calculated from the ratio of white light to experimental spectra while in transmittance mode (0o excitation, 180o reception).
In all cases mitochondria were Ca2+ depleted for 6 min. in running buffer (125 mM KCl, 20 mM HEPES, 15 mM NaCl, 5 mM MgCl2, 1 mM K2EDTA, 1 mM EGTA, 2 mM Pi, 0.1mM malate, with 3.4 mM Na2ATP added daily, pH 7) prior to start of the experiment. In all cases, substrates, ATPase (1.6IU.ml-1), and Ca2+ were added serially as indicated in figure legends.
Results
A |
 |
|
 |
B |
 |
C |
 |
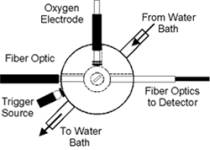
Figure 1.
Diagram of optical setup and Hb spectra used to estimate [O2]. (A) Optical chamber setup used to collect optical spectra, shown in orthogonal views. Trigger light was used to optically time stamp spectra at the point of substrate addition. (B) Plot of optical spectra acquired at various soluble O2 tensions between 21 and 0% O2 in a mixture containing 1nmol Cyta.ml-1 and 1.05nmol Hb.ml-1. (C) Standard curve plot of fractional Hb saturation (Fsat) vs. soluble O2 for spectra shown in Figure 1B. Calculations of Hb optical difference and Fsat were as described in Eqn. 1-2. Determination of dissolved oxygen at low temporal resolution was provided by the polarographic O2 electrode. Provided this relationship, high temporal resolution spectra could be collected and total O2 content determined by mathematical transformation as described in Eqns. 1-5. All spectra were acquired at 100mSec temporal resolution. |
|
Figure 2.
Linearity and sensitivity validation for Hb optical technique. (A) Plot of [O2] vs. time (n=3). Mitochondria were incubated for 6 min as described in Material and Methods section at 40kPa O2, where 5mM G/M was added as the reducing equivalents. State 3 respiration was initiated with a single addition of 1.6IU.ml-1 ATPase (final), and optical spectra acquired between 21% and 0% O2 at maximal State 3. Data are presented as means ? 1 SEM for the three studies. (inset) Plot of [O2] vs. time for a subset of data presented in Figure 2A. Data are presented as means ? SEM, where the solid line is a least squares linear regression. Regression results from are presented in Table 1. (B) Plot of [O2] vs. time for mitochondria oxidizing 5mM G/M in the presence (open symbols) and absence (filled symbols) of 535nM free Ca2+. Downward deflections indicate point of addition for a given substrate and were generated by external source light. |
![(A) Plot of O2 content vs. time for mitochondria oxidizing 5mM G/M.
(B) The effects of [Ca2+] on IRT were performed as paired studies from 0nM to 1840nM free Ca2+ (n=7).
(C) Time line of substrate and enzyme additions used to estimate IRT.
(D) Substrate additions (i.e. ADP, Creatine, G/M, Ca2+, ruthenium red (RuRed), and EGTA), OTS, and IRT were as indicated for inset A.](images/mito-rapid-scattering12.gif)
|
Figure 3.
(A) Plot of O2 content vs. time for mitochondria oxidizing 5mM G/M. Post Ca2+ depletion, State 3 respiration was initiated with a single addition of ATPase (1.6IU.ml-1 final), followed with a single bolus of 535nM Ca2+ at steady state. Two ROIs were delineated, and least-squares linear regression performed prior to (solid line) and post Ca2+ addition (dashed line). (Inset A) A subset of data plotted in Figure 3A showing regressions indicated and IRT. IRT was determined as the time difference from the middle of the OTS to the intersection of the two regressions. (B) The effects of [Ca2+] on IRT were performed as paired studies from 0nM to 1840nM free Ca2+ (n=7). (Inset B) The effects of [Ca2+] on mVO2 were performed as paired studies from 0nM to 1840nM free Ca2+, sample size given in brackets. (C) Time line of substrate and enzyme additions used to estimate IRT. (D) Substrate additions (i.e. ADP, Creatine, G/M, Ca2+, ruthenium red (RuRed), and EGTA), OTS, and IRT were as indicated for inset A. The corresponding sample size (n) for each treatment are indicated by brackets. In all cases data are presented as means ? SEM, and significance indicated on the figure with either asterisks (*) or square brackets indicating the grouping (p?0.05 dependent variable t-test). |
![(A) NADH vs. time for mitochondria oxidizing 5mM G/M. (B) A subset of data plotted in Figure 4A indicating the two ROIs over which the regression analysis was performed. NADH Initial response time (IRT) with [Ca2+]. (C) The effects of [Ca2+] on NADH IRT were performed as paired studies from 0nM to 1840nM free Ca2+ (n=7). (D) The effects of [Ca2+] on NADH production rate in mitochondria oxidizing 5mM G/M.](images/mito-rapid-scattering14.gif)
|
Figure 4.
(A) NADH vs. time for mitochondria oxidizing 5mM G/M. Post Ca2+ depletion, State 3 respiration was initiated with a single addition of ATPase (1.6IU.ml-1 final), followed with a single bolus of 535nM Ca2+ at steady state. Two ROIs were delineated, and least-squares linear regression performed as described in Figure 3. (B) A subset of data plotted in Figure 4A indicating the two ROIs over which the regression analysis was performed. NADH Initial response time (IRT) with [Ca2+]. (C) The effects of [Ca2+] on NADH IRT were performed as paired studies from 0nM to 1840nM free Ca2+ (n=7). (D) The effects of [Ca2+] on NADH production rate in mitochondria oxidizing 5mM G/M. In all cases data are presented as means ? SEM, and significance indicated on the figure with asterisks (*) (p?0.05 dependent variable t-test). |
|
|
![The effects of [Ca2+] on IRT at State 3 respiration. IRT was calculated as describe in Figure 3 legend.](images/mito-rapid-scattering20.gif)
|
![The effects of [Ca2+] on light scattering rate in mitochondria. In all cases, depletion and substrate additions were made as per Figure 5A. Data are presented as mean ? SEM, where asterisks (*) indicate significant differences from nominally zero [Ca2+] (p?0.05 dependent variable t-test), and sample size (n) are indicated by brackets.](images/mito-rapid-scattering22.gif)
|
Figure 5.
(A) Light scattering for 6 cytochrome isosbestic wavelengths (455, 510, 520, 540, 575, and 630nm) vs. time. Mitochondria were Ca2+ depleted, reduced with 5mM G/M, and State 3 respiration initiated with a single addition of 1.6IU.ml-1 (final) ATPase. At steady state 535nM Ca2+ was added. (B) A subset of data plotted in Figure 5A indicating the ROIs over which the regression analysis was performed prior to (solid line), and post (dashed line) Ca2+ addition. (C) The effects of [Ca2+] on IRT at State 3 respiration. IRT was calculated as describe in Figure 3 legend. (D) The effects of [Ca2+] on light scattering rate in mitochondria. In all cases, depletion and substrate additions were made as per Figure 5A. Data are presented as mean ? SEM, where asterisks (*) indicate significant differences from nominally zero [Ca2+] (p?0.05 dependent variable t-test), and sample size (n) are indicated by brackets. |
Conclusions
Ca2+ activated State 3 mVO2 in a dose dependent manor, with response times as low as ~250mSec at optimal free [Ca2+] (535nM).
IRT for Ca2+ activation at 535nM were between ~10X and ~50X faster than adenylate and creatine stimulated respiration, respectively.
Ca2+ activation IRTs were RuRed sensitive, and reversible with exogenous EGTA indicating dependence of matrix accumulation.
Ca2+ activated State 3 mVNADH in a dose dependent manor, and had response times of ~200mSec at 535nM free Ca2+.
Ca2+ stimulation of State 3 mVus was also dose dependent across all wavelengths, however IRT were not sensitive to [Ca2+] and approached the mixing times of the chamber.
Overall these data suggest that Ca2+ activation of ox-phos occurs on a rapid time scale, and are capable of matching variations in workload.
Activation of CaDH is capable of maintaining driving force for ATP synthesis on a time scale faster than mVO2.
Light scattering changes were concomitant with metabolic perturbations, suggesting that mitochondrial volume may play a role in this activation either directly or indirectly.
References
B. Chance, G. Williams, J. Biol. Chem. 217, 383-393 (1955).
L. A. Katz, J. A. Swain, M. A. Portman, R. S. Balaban, Am J Physiol 256, H265-74 (1989).
J. A. Detre, D. S. Williams, A. P. Koretsky, NMR Biomed 3, 272-8 (1990).
A. P. Koretsky, Physiol Rev 75, 667-88 (1995).
S. D. Wolff, C. Eng, R. S. Balaban, Am J Physiol 255, F581-9 (1988).
C. J. Wingard, R. J. Paul, R. A. Murphy, J Physiol (Lond) 501, 213-23 (1997).
R. M. Denton, J. G. McCormack, Annu Rev Physiol 52, 451-66 (1990).
P. R. Territo, S.A. French, R.S. Balaban, Am J Physiol (in press).
A. M. Das, D. A. Harris, Biochem Soc Trans 18: 554-5, (1990).
W. G. Wier, J. R. Lopez-Lopez, et al., Ciba Found Symp 188: 146-60, (1995).
R. Rizzuto, et al., Science 280, 1763-6, (1998).
E. Chacon, H. Ohata, et al., FEBS Lett 382: 31-6, (1996).
G. S. Isenberg, A. Han, et al., Cardiovasc Res 27: 1800-9, (1993).
T. E. Gunter, L. Buntinas, et al., Biochim Biophys Acta 1366: 5-15, (1998).
G. C. Sparagna, K. K. Gunter, et al., J Biol Chem 270: 27510-5, (1995).
S. A. French, P. R. Territo, R. S. Balaban, Am J Physiol (1998).
R. S. Balaban, V. K. Mootha, A. Arai, Anal Biochem 237, 274-8 (1996).
|